Sample Reporting
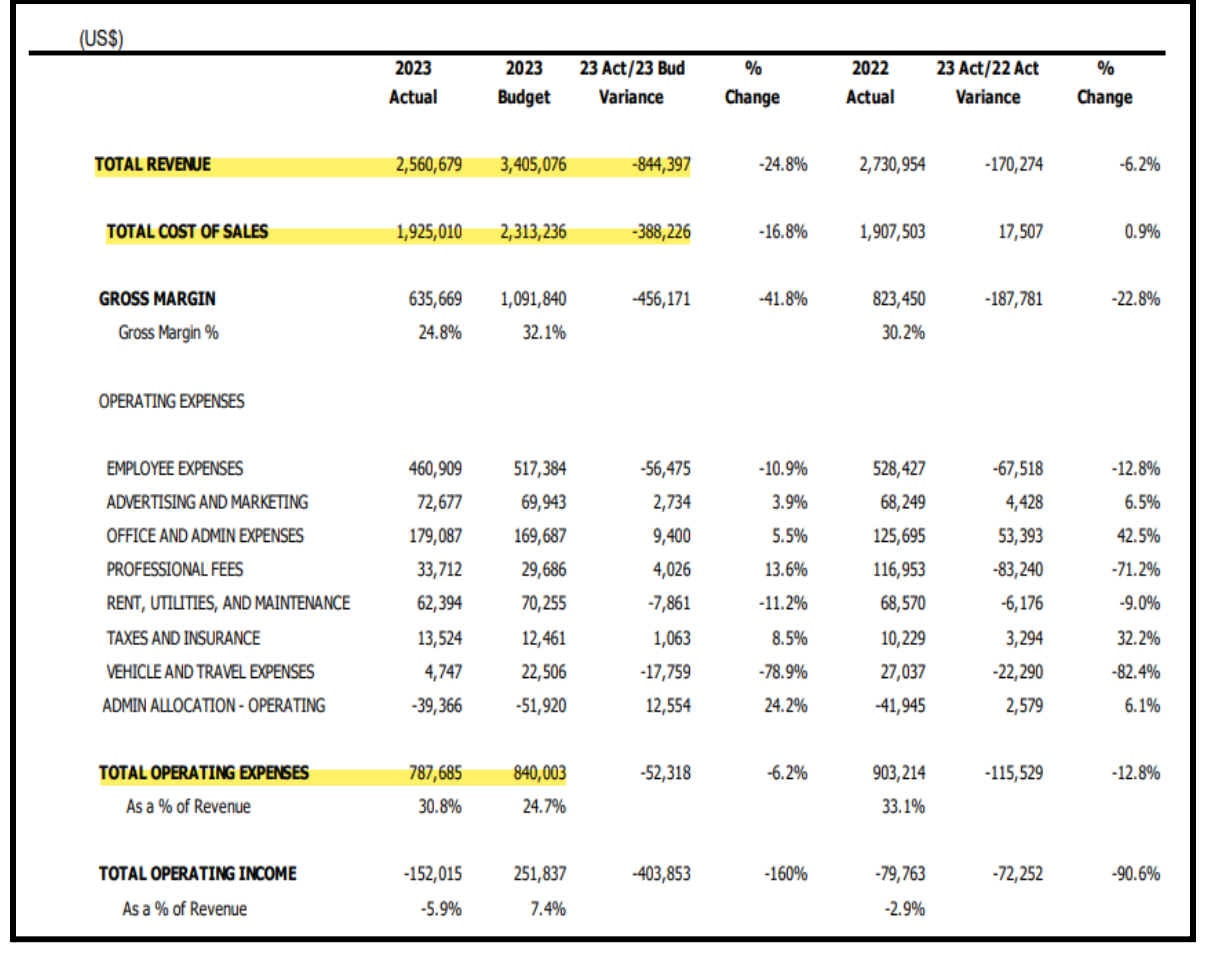
Standard PDF Reporting Export
Typical Data Presentation: PDF file
PDF file with basic comparative analytics – no visual cues for problem areas
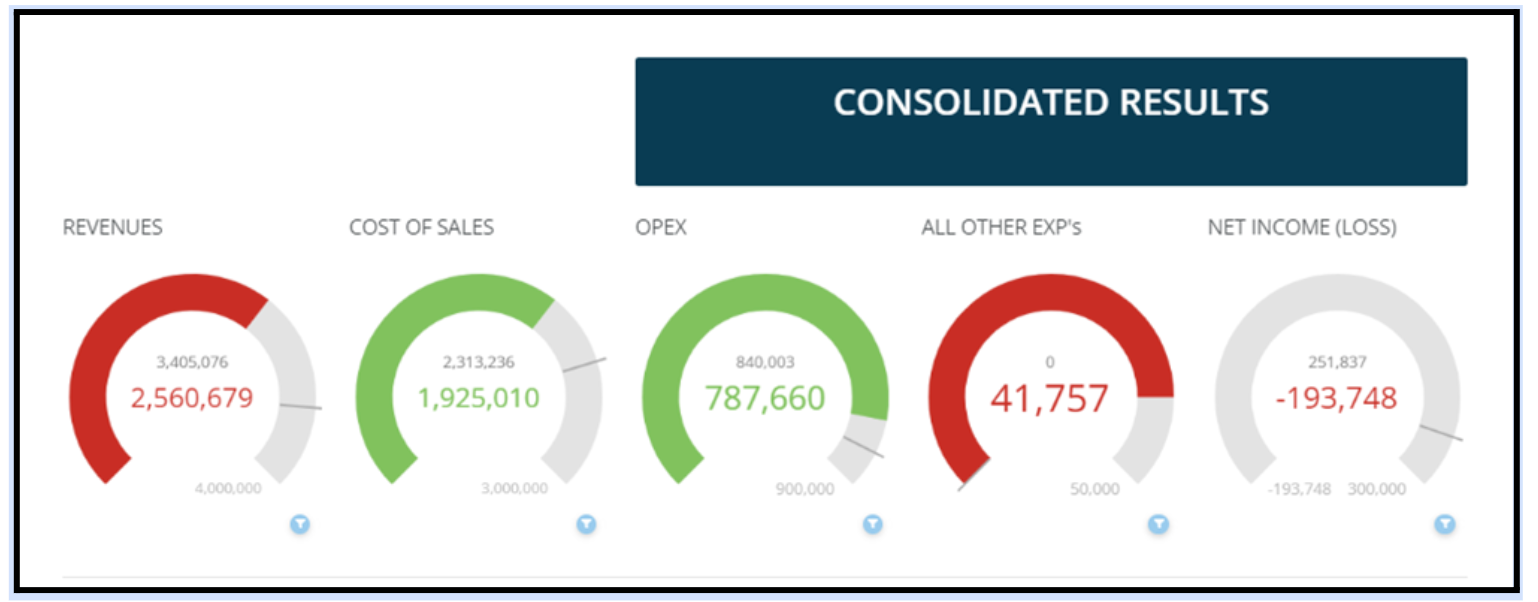
NuVu Radial Dial Stoplight Charts
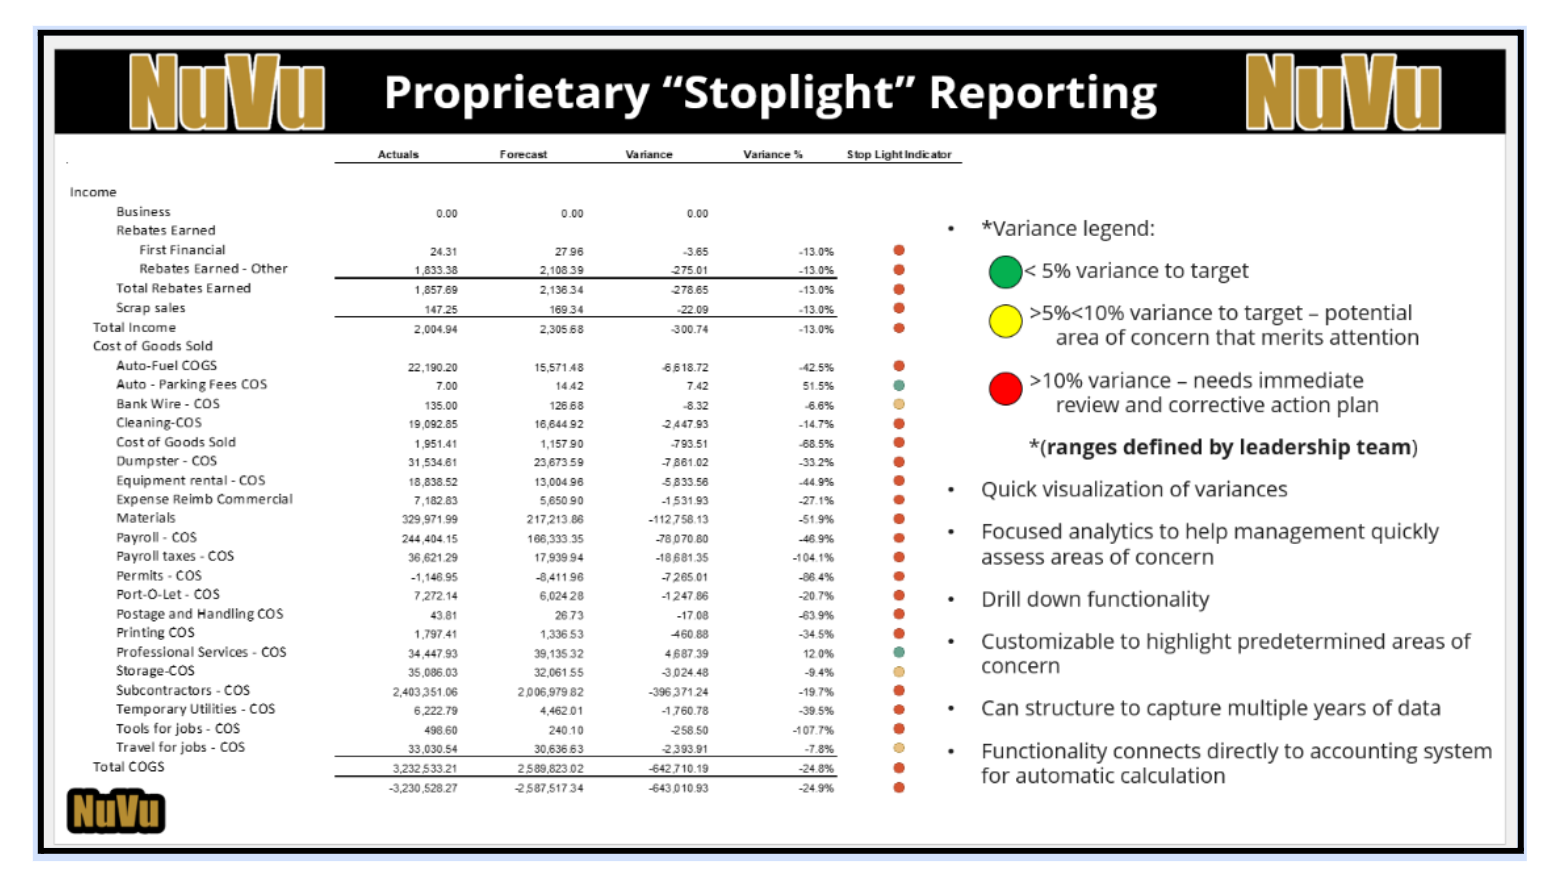
NuVu Graphical Data Presentation: Stoplight Indicators
Automatic Generation of Visual Indicators of Priority Areas
GREEN: No issue
YELLOW: Area To Be Aware Of
RED: Significant Variance – Area of Concern for Immediate Review & Corrective Action
Excel P&L Stoplight Chart
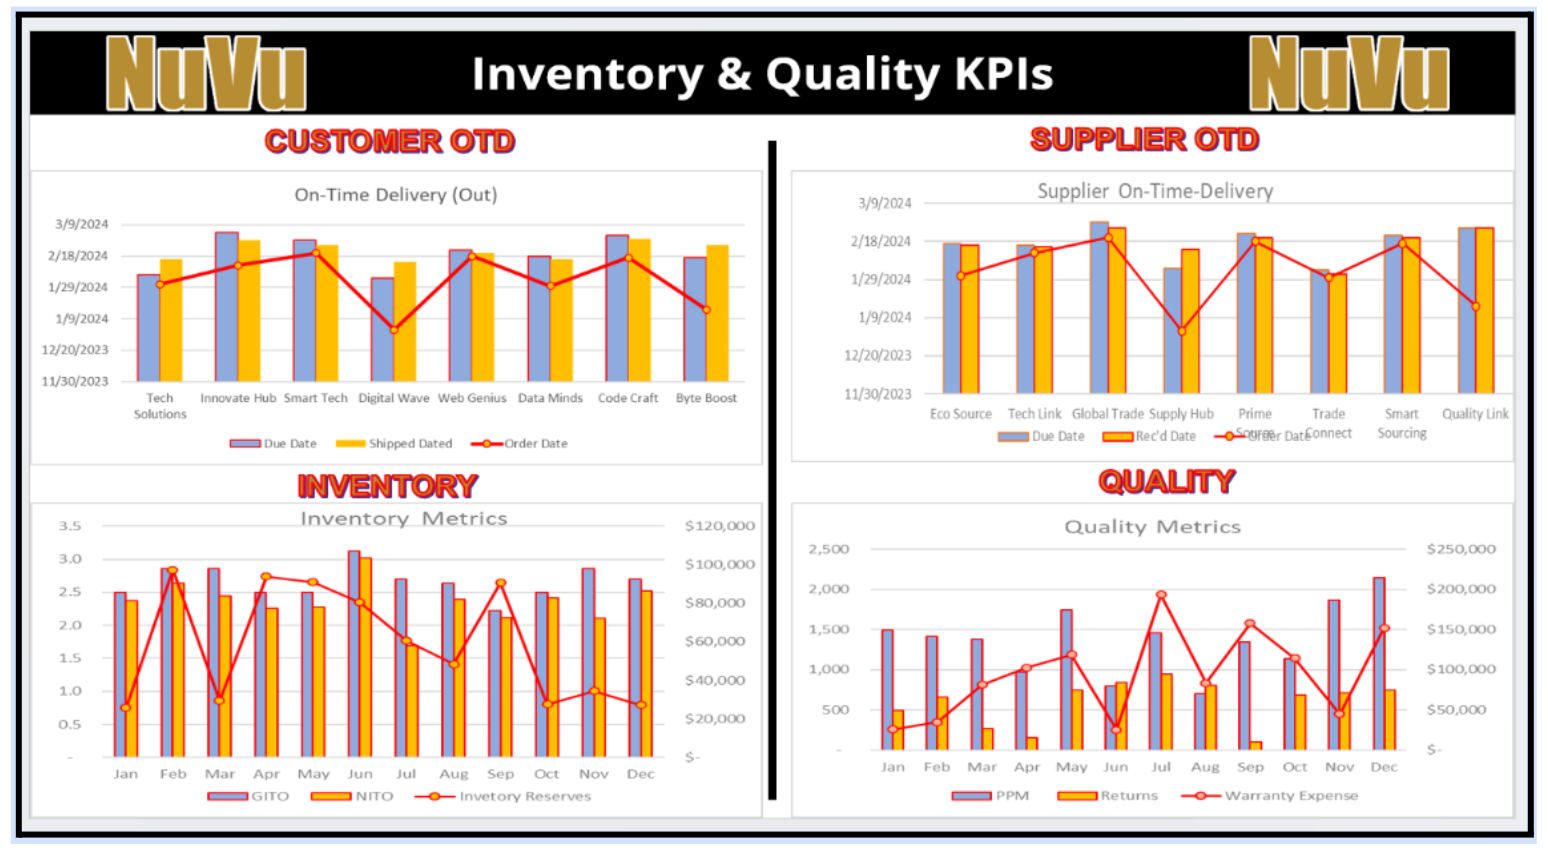
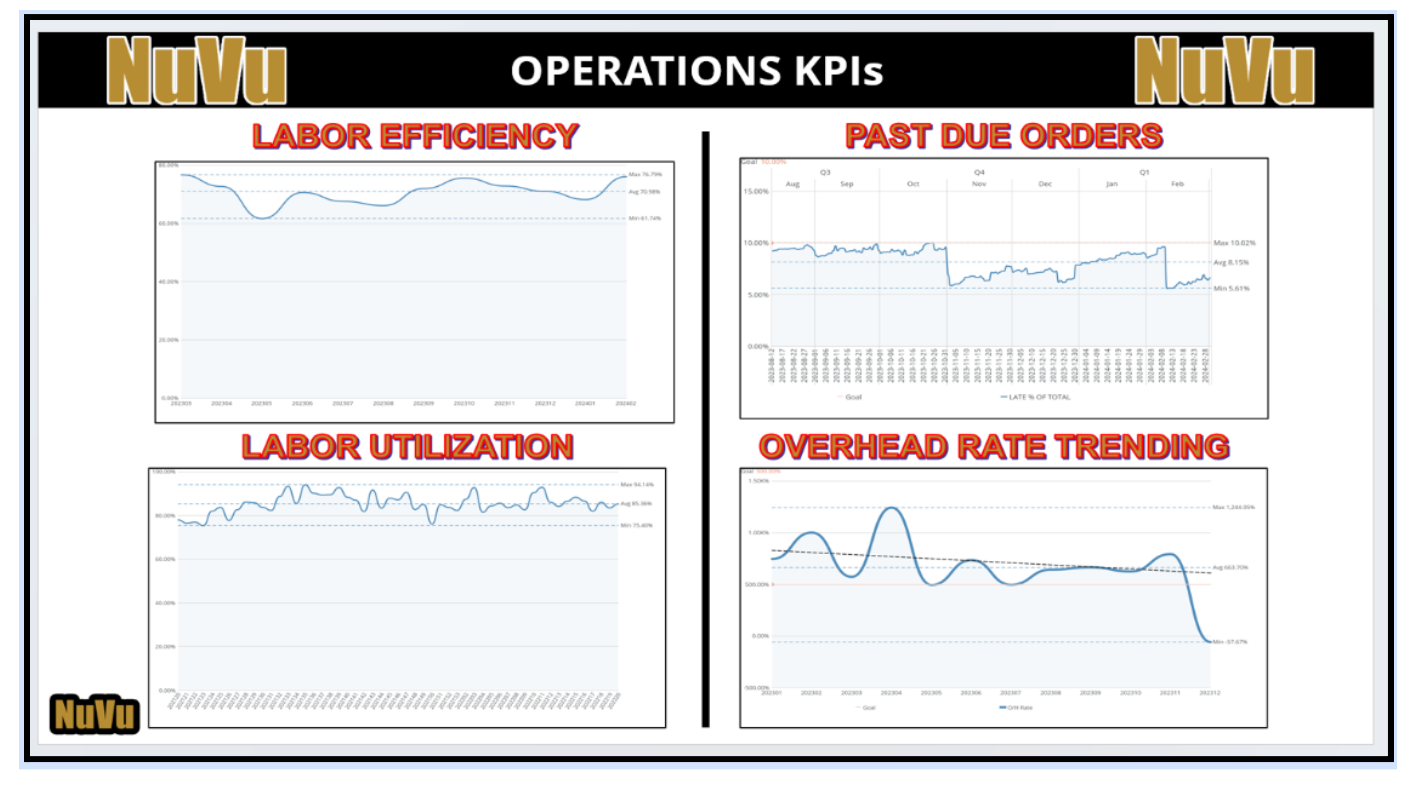
Operations Metrics
Inventory Metrics